Portfolio

Construction analytics, end to end.

Each case study starts with a question a project manager actually asks, works through the data, and ends with what to do about it. Data, SQL, Python, dashboards and the full report are public on GitHub.

  1. Descriptive and early-warning analyticsConstruction Project Controls Analytics
  2. Diagnostic workflow analyticsConstruction Change Order and RFI Analytics
  3. Predictive early-warning modelingPredictive Construction Project Overrun Model
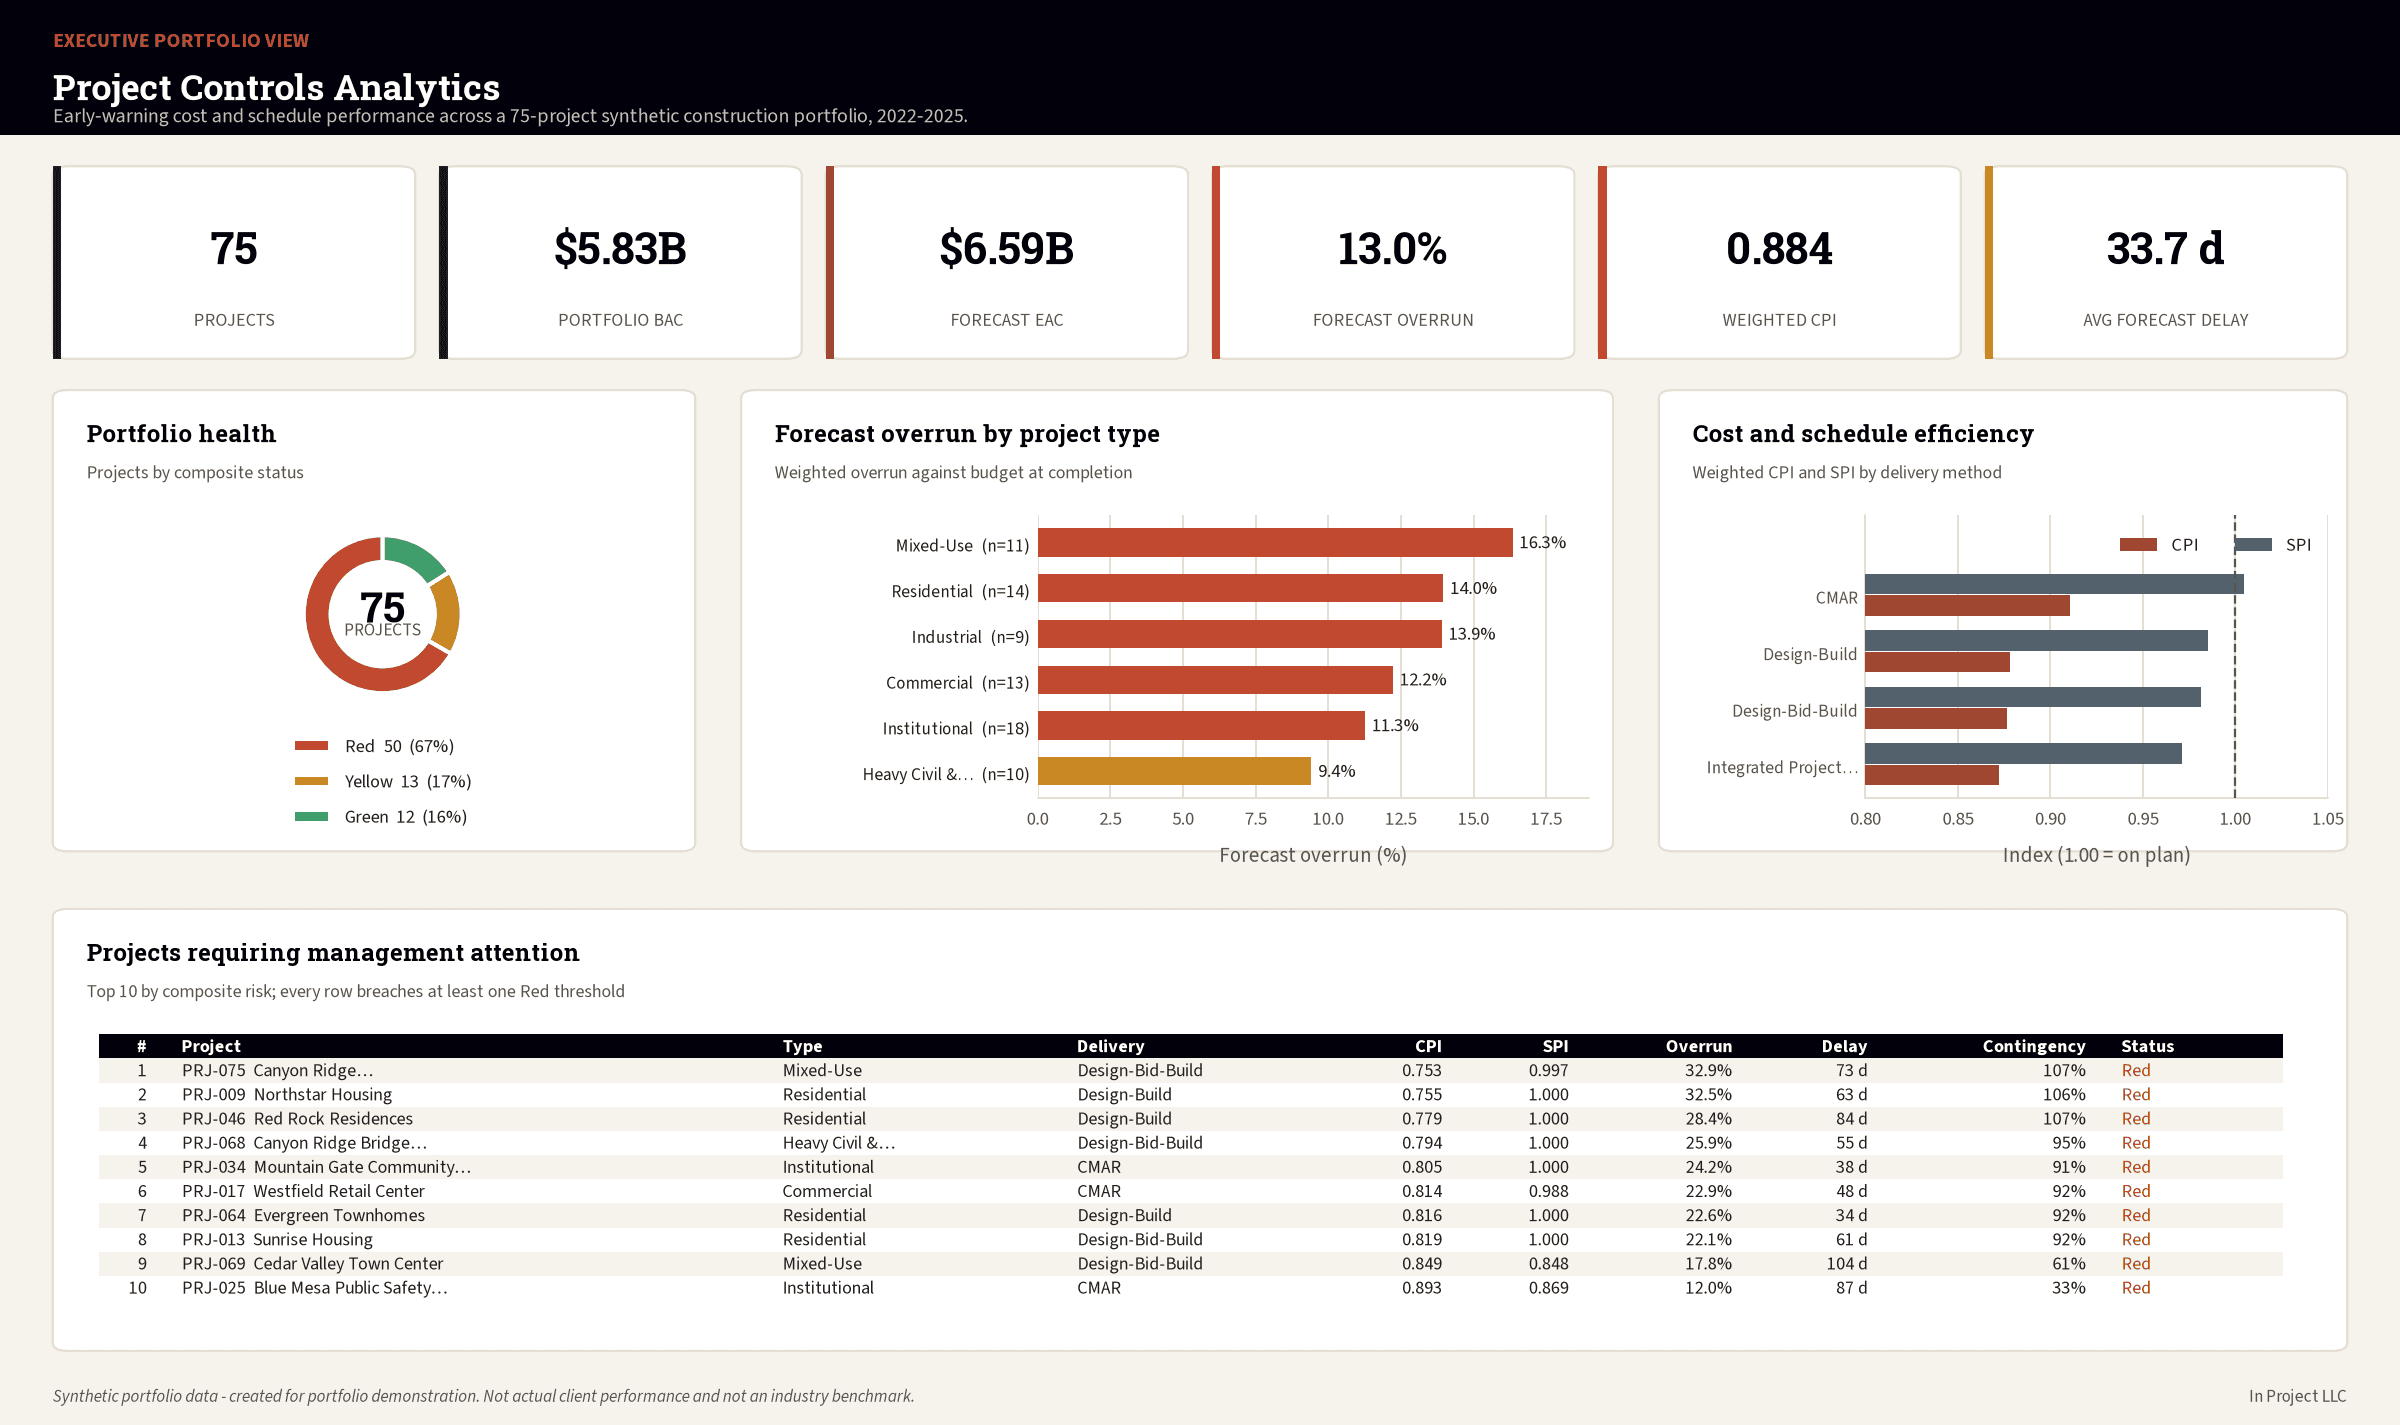
Executive dashboard showing portfolio health, forecast overrun by project type, cost and schedule efficiency, and the top-10 review list
Complete and PublicSynthetic data

Construction Project Controls Analytics

Early Warning Analysis for Cost and Schedule Performance

Descriptive and early-warning analytics

Project teams often detect cost and schedule stress after intervention options have narrowed. This case study tests which controls metrics move early enough to support management action.

75 synthetic projects · $5.83B portfolio · 2022–2025

75 synthetic projects$5.83B portfolio BAC13.0% forecast overrunWeighted CPI 0.884Average delay 33.7 days50 Red, 13 Yellow, 12 Green

All project, client, cost, schedule, RFI, and change-order data in this case study is synthetic and does not represent actual client performance or confidential records.
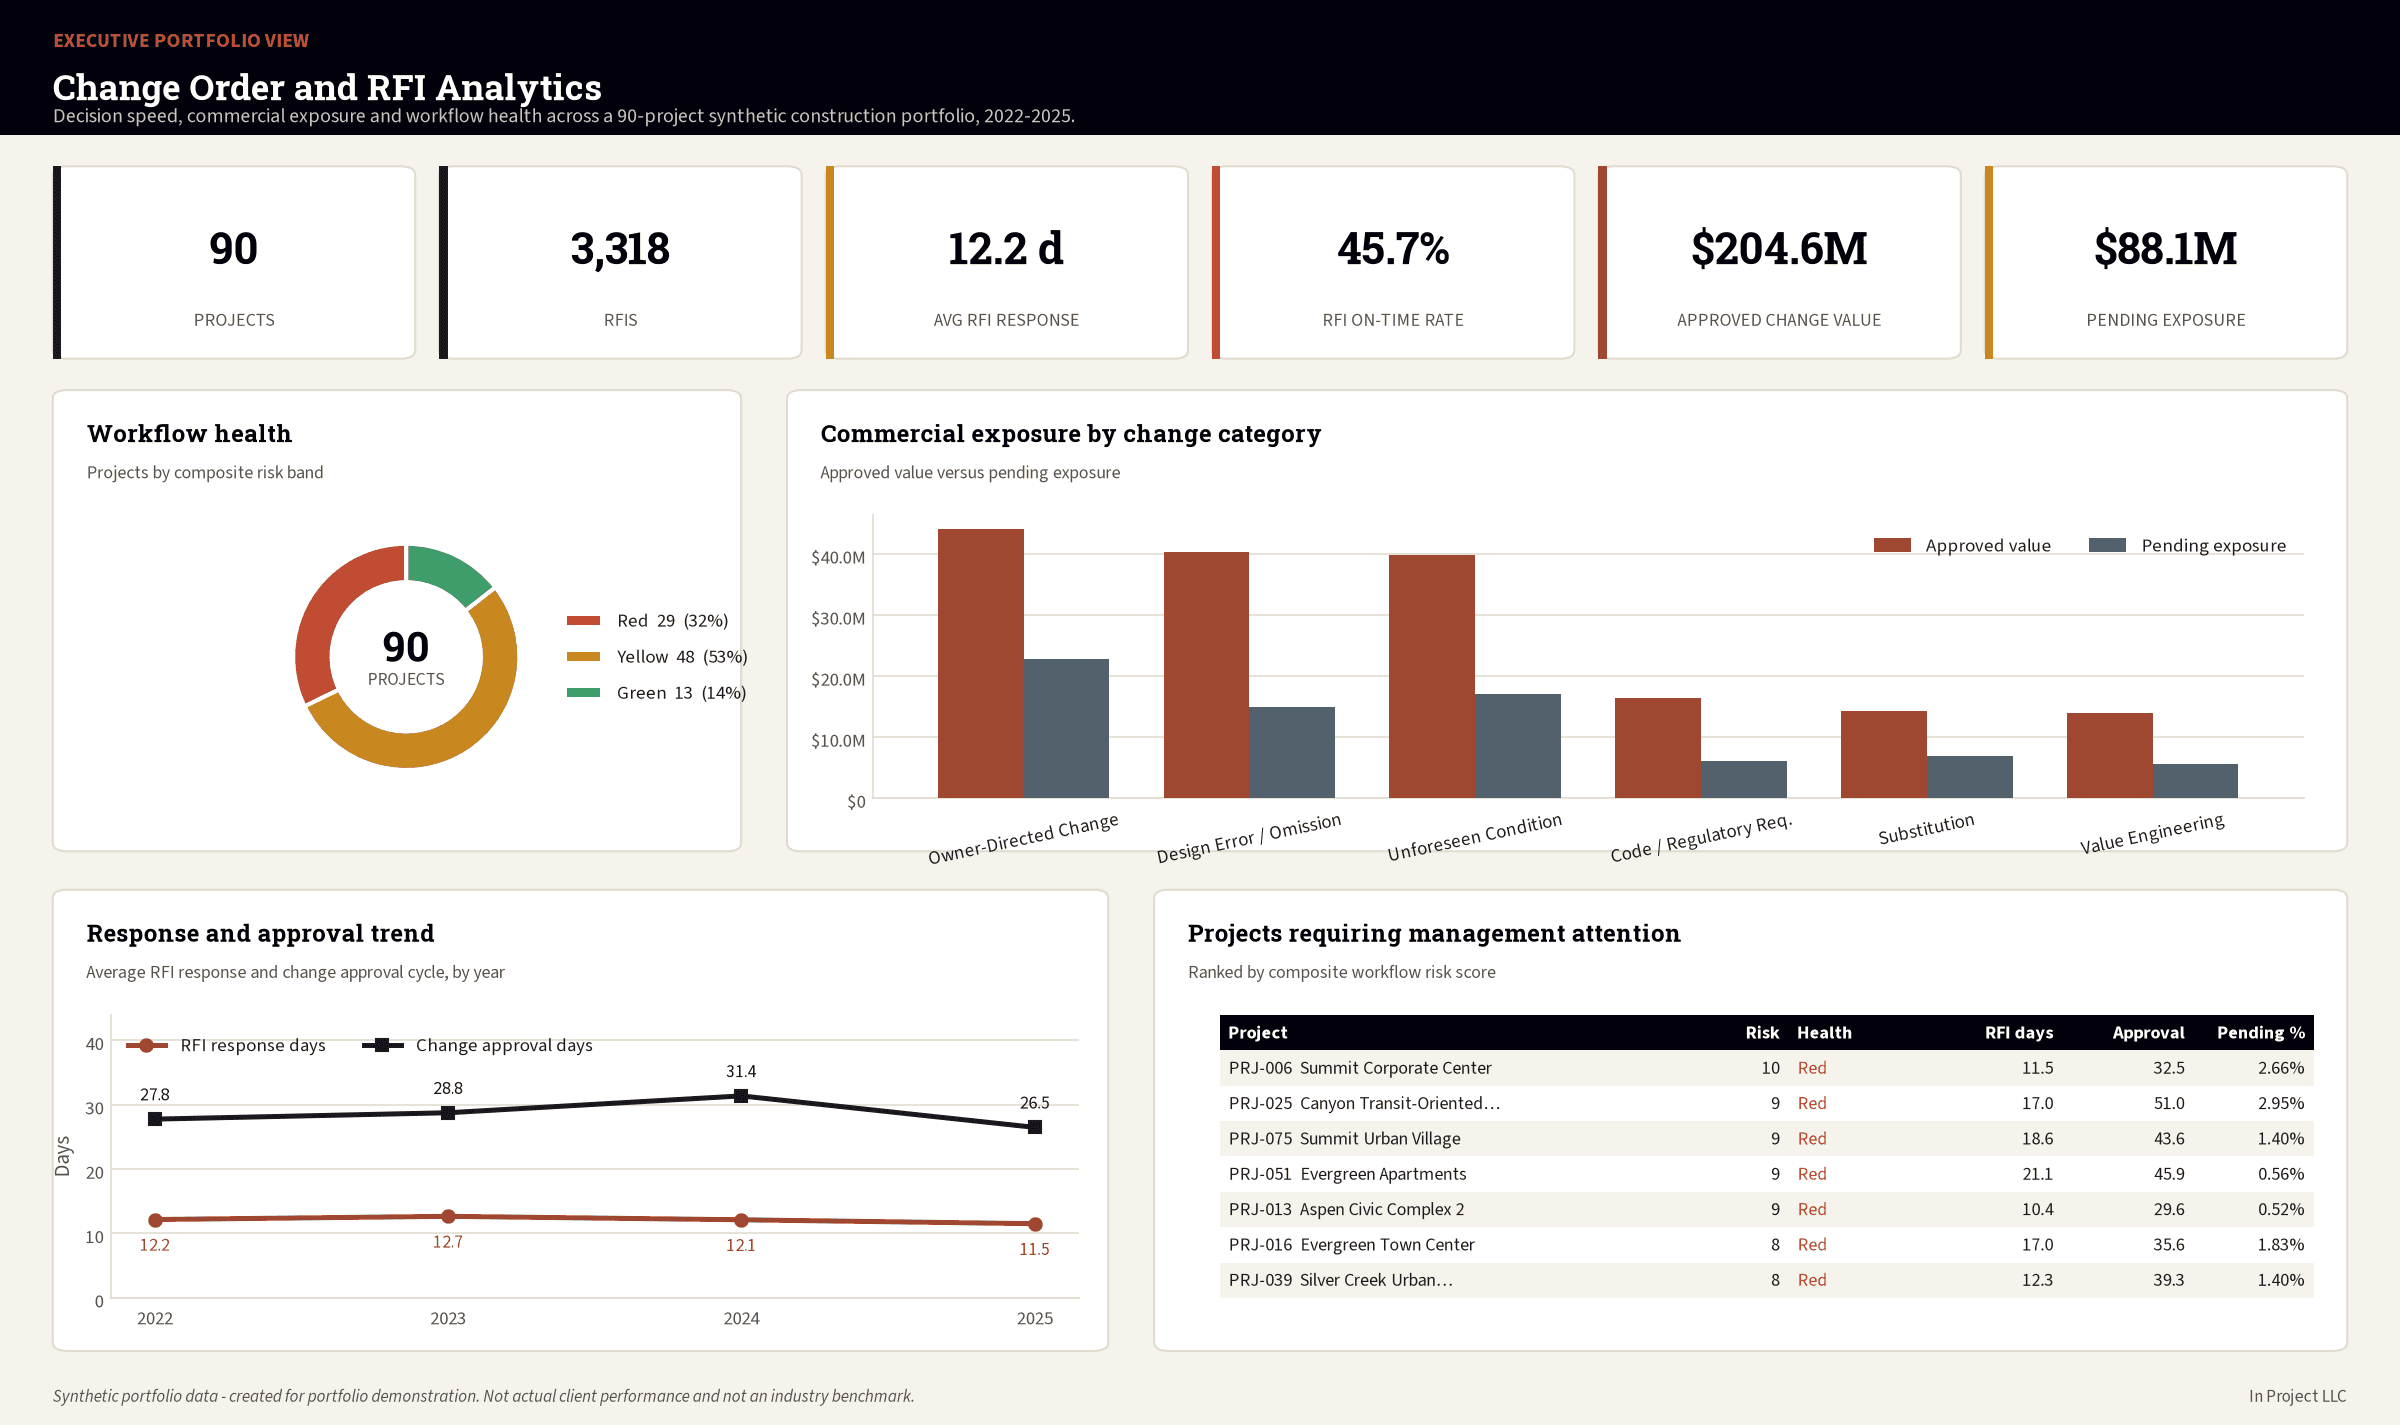
Executive dashboard showing RFI response performance, commercial exposure by change category, workflow health, and the projects needing attention
Complete and PublicSynthetic data

Construction Change Order and RFI Analytics

Root-Cause, Cycle-Time, and Impact Analysis for Construction Decision Workflows

Diagnostic workflow analytics

Change orders and RFIs move through many reviews, handoffs, and approvals. This case study identifies where cycle time, aging, backlog, and handoff patterns create cost and schedule exposure.

90 synthetic projects · 3,318 RFIs · 1,119 change orders · 2022–2025

90 synthetic projects3,318 RFI records1,119 change orders12.21-day average RFI response$204.57M approved change value29 Red, 48 Yellow, 13 GreenPearson r = 0.817 tested relationship

All projects, organizations, people, budgets, schedules, RFIs, change orders, workflow events, and performance records in this case study are synthetic and must not be represented as actual client, company, or industry-benchmark information.

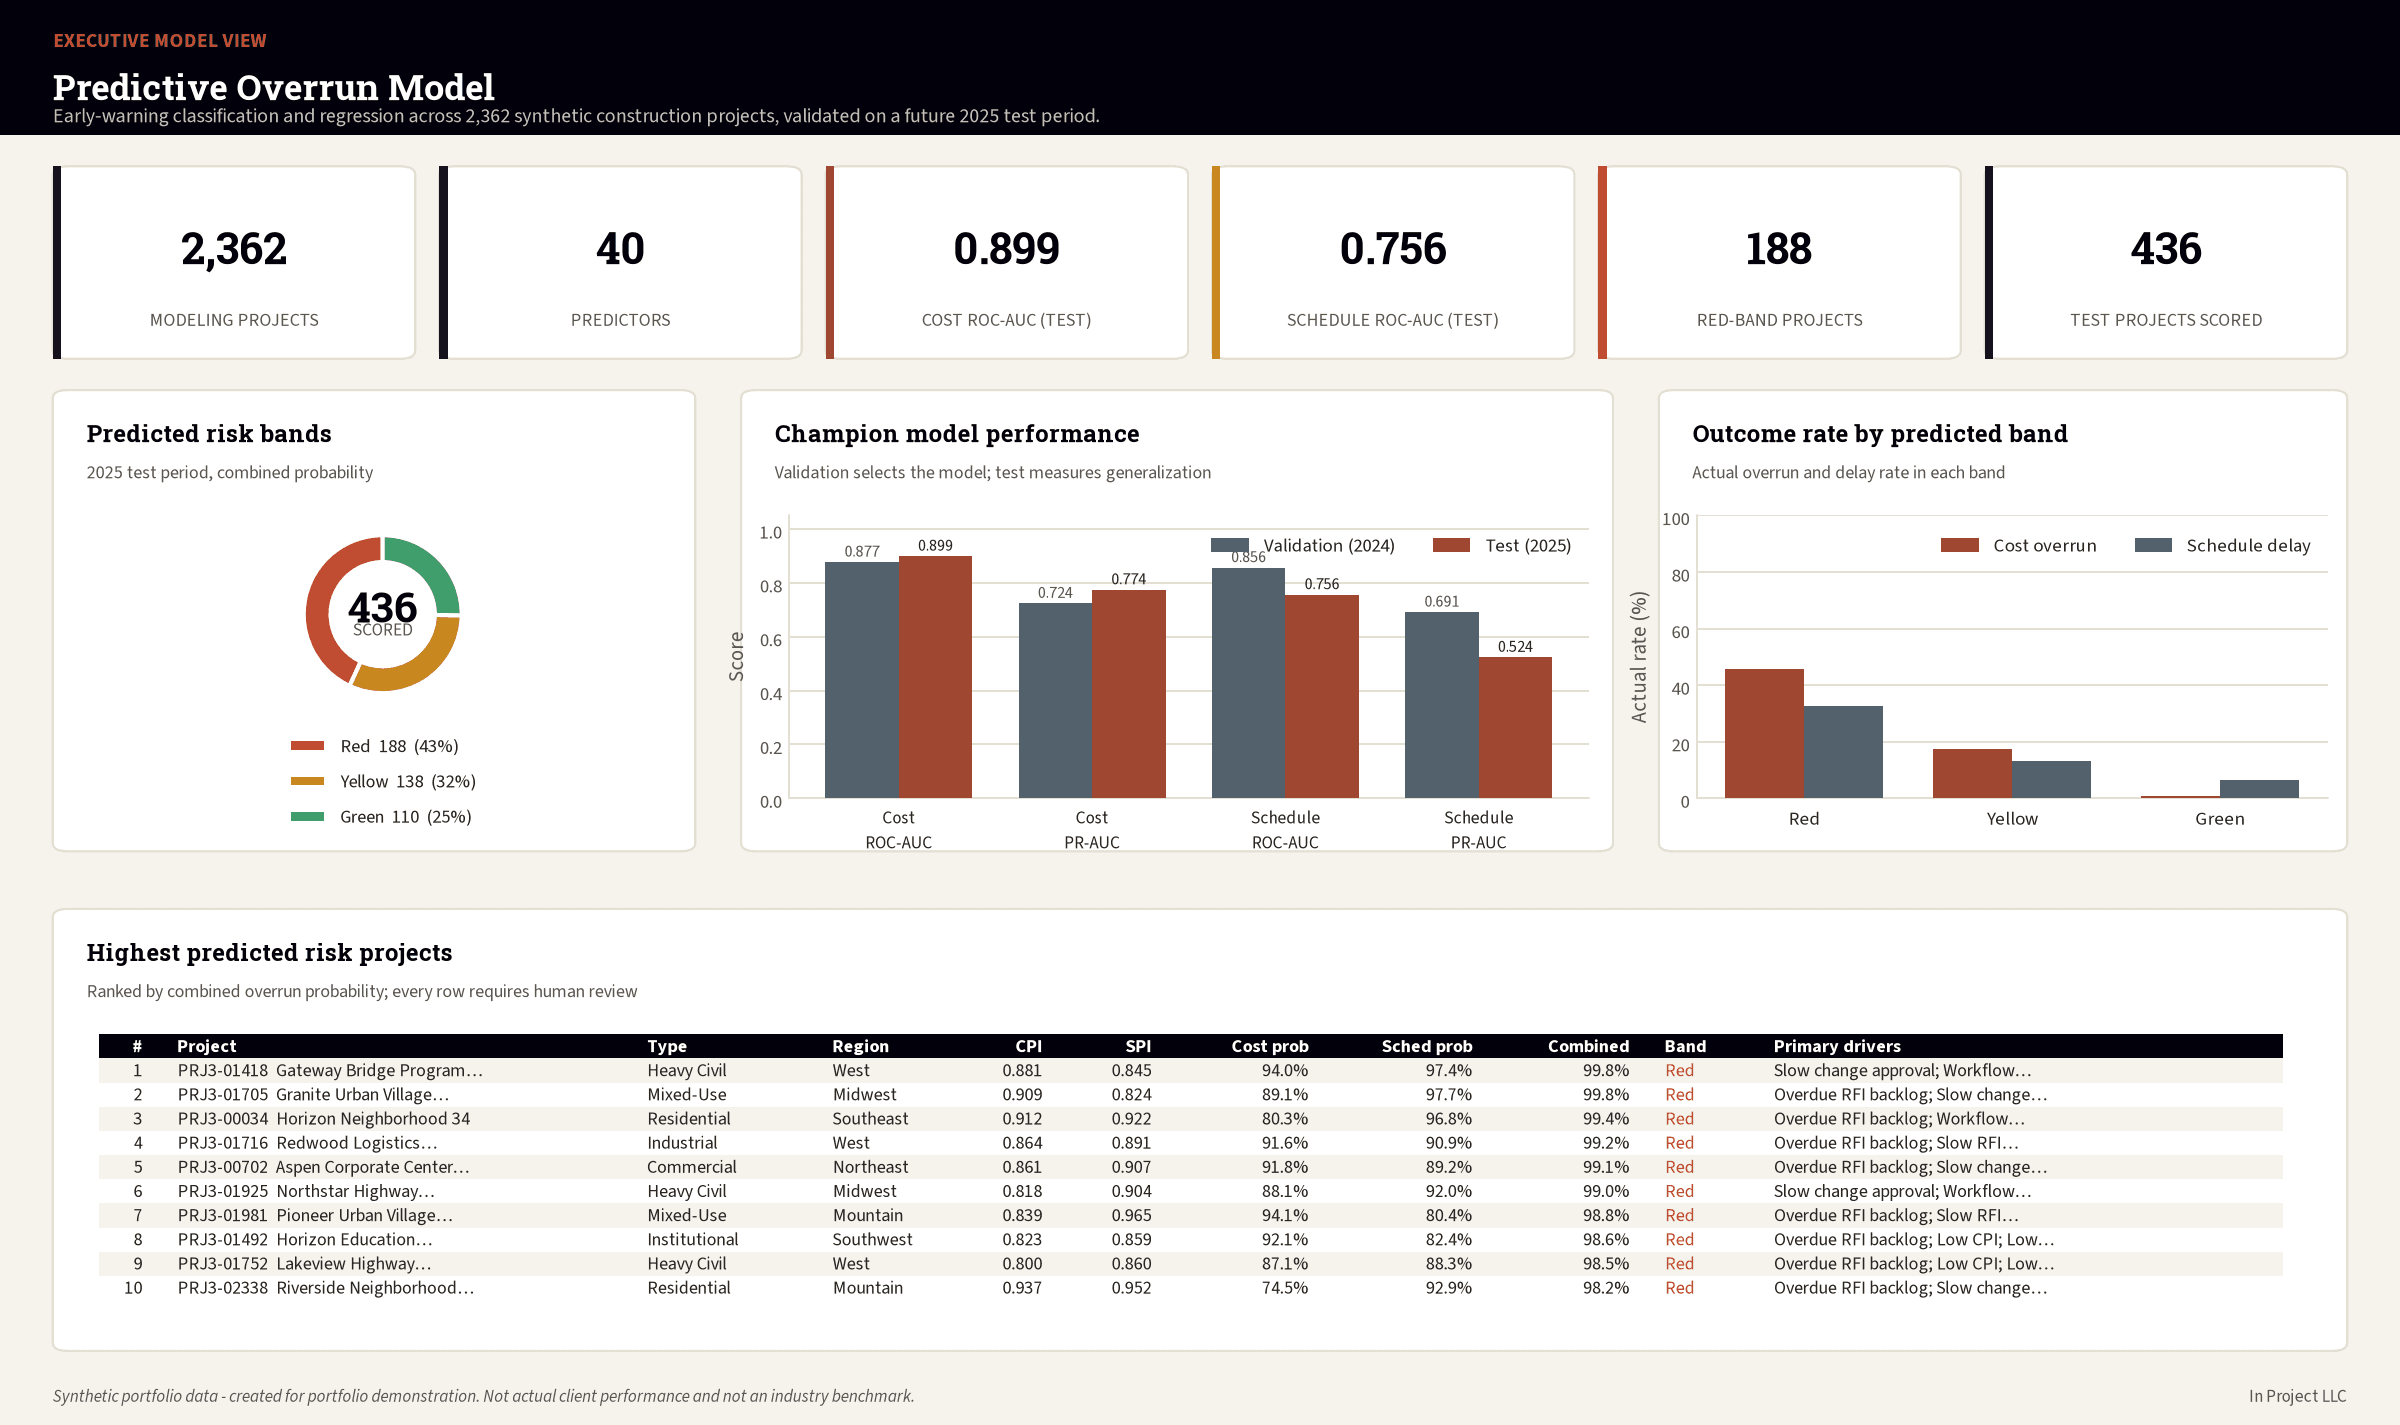
Executive model dashboard showing predicted risk bands, champion model performance, and the highest predicted-risk projects
Complete and PublicSynthetic data

Predictive Construction Project Overrun Model

Early-Warning Classification and Regression for Cost Overruns and Schedule Delays

Predictive early-warning modeling

Cost and schedule outcomes are usually confirmed too late to change them. This case study tests which early and mid-project controls and workflow indicators predict material overruns and delays while intervention is still possible.

2,362 clean modeling projects · 40 predictors · 2019–2025

2,362 clean modeling projects40 predictorsTime-based 2019–2025 splitCost ROC-AUC 0.899, PR-AUC 0.774Schedule ROC-AUC 0.756, PR-AUC 0.524188 Red, 138 Yellow, 110 GreenHuman review required before action

All projects, organizations, budgets, schedules, workflow records, and outcomes in this case study are synthetic. Model results are portfolio demonstrations, not industry benchmarks.

On the data. Case studies marked Synthetic data use datasets generated for portfolio demonstration. They show method and decision support, and do not represent actual client performance or industry benchmarks. Each case study states this on its own page.