Cost and schedule outcomes are usually confirmed too late to change them. This case study tests which early and mid-project controls and workflow indicators predict material overruns and delays while intervention is still possible.
Dashboard
2,362 clean modeling projects · 40 predictors · 2019–2025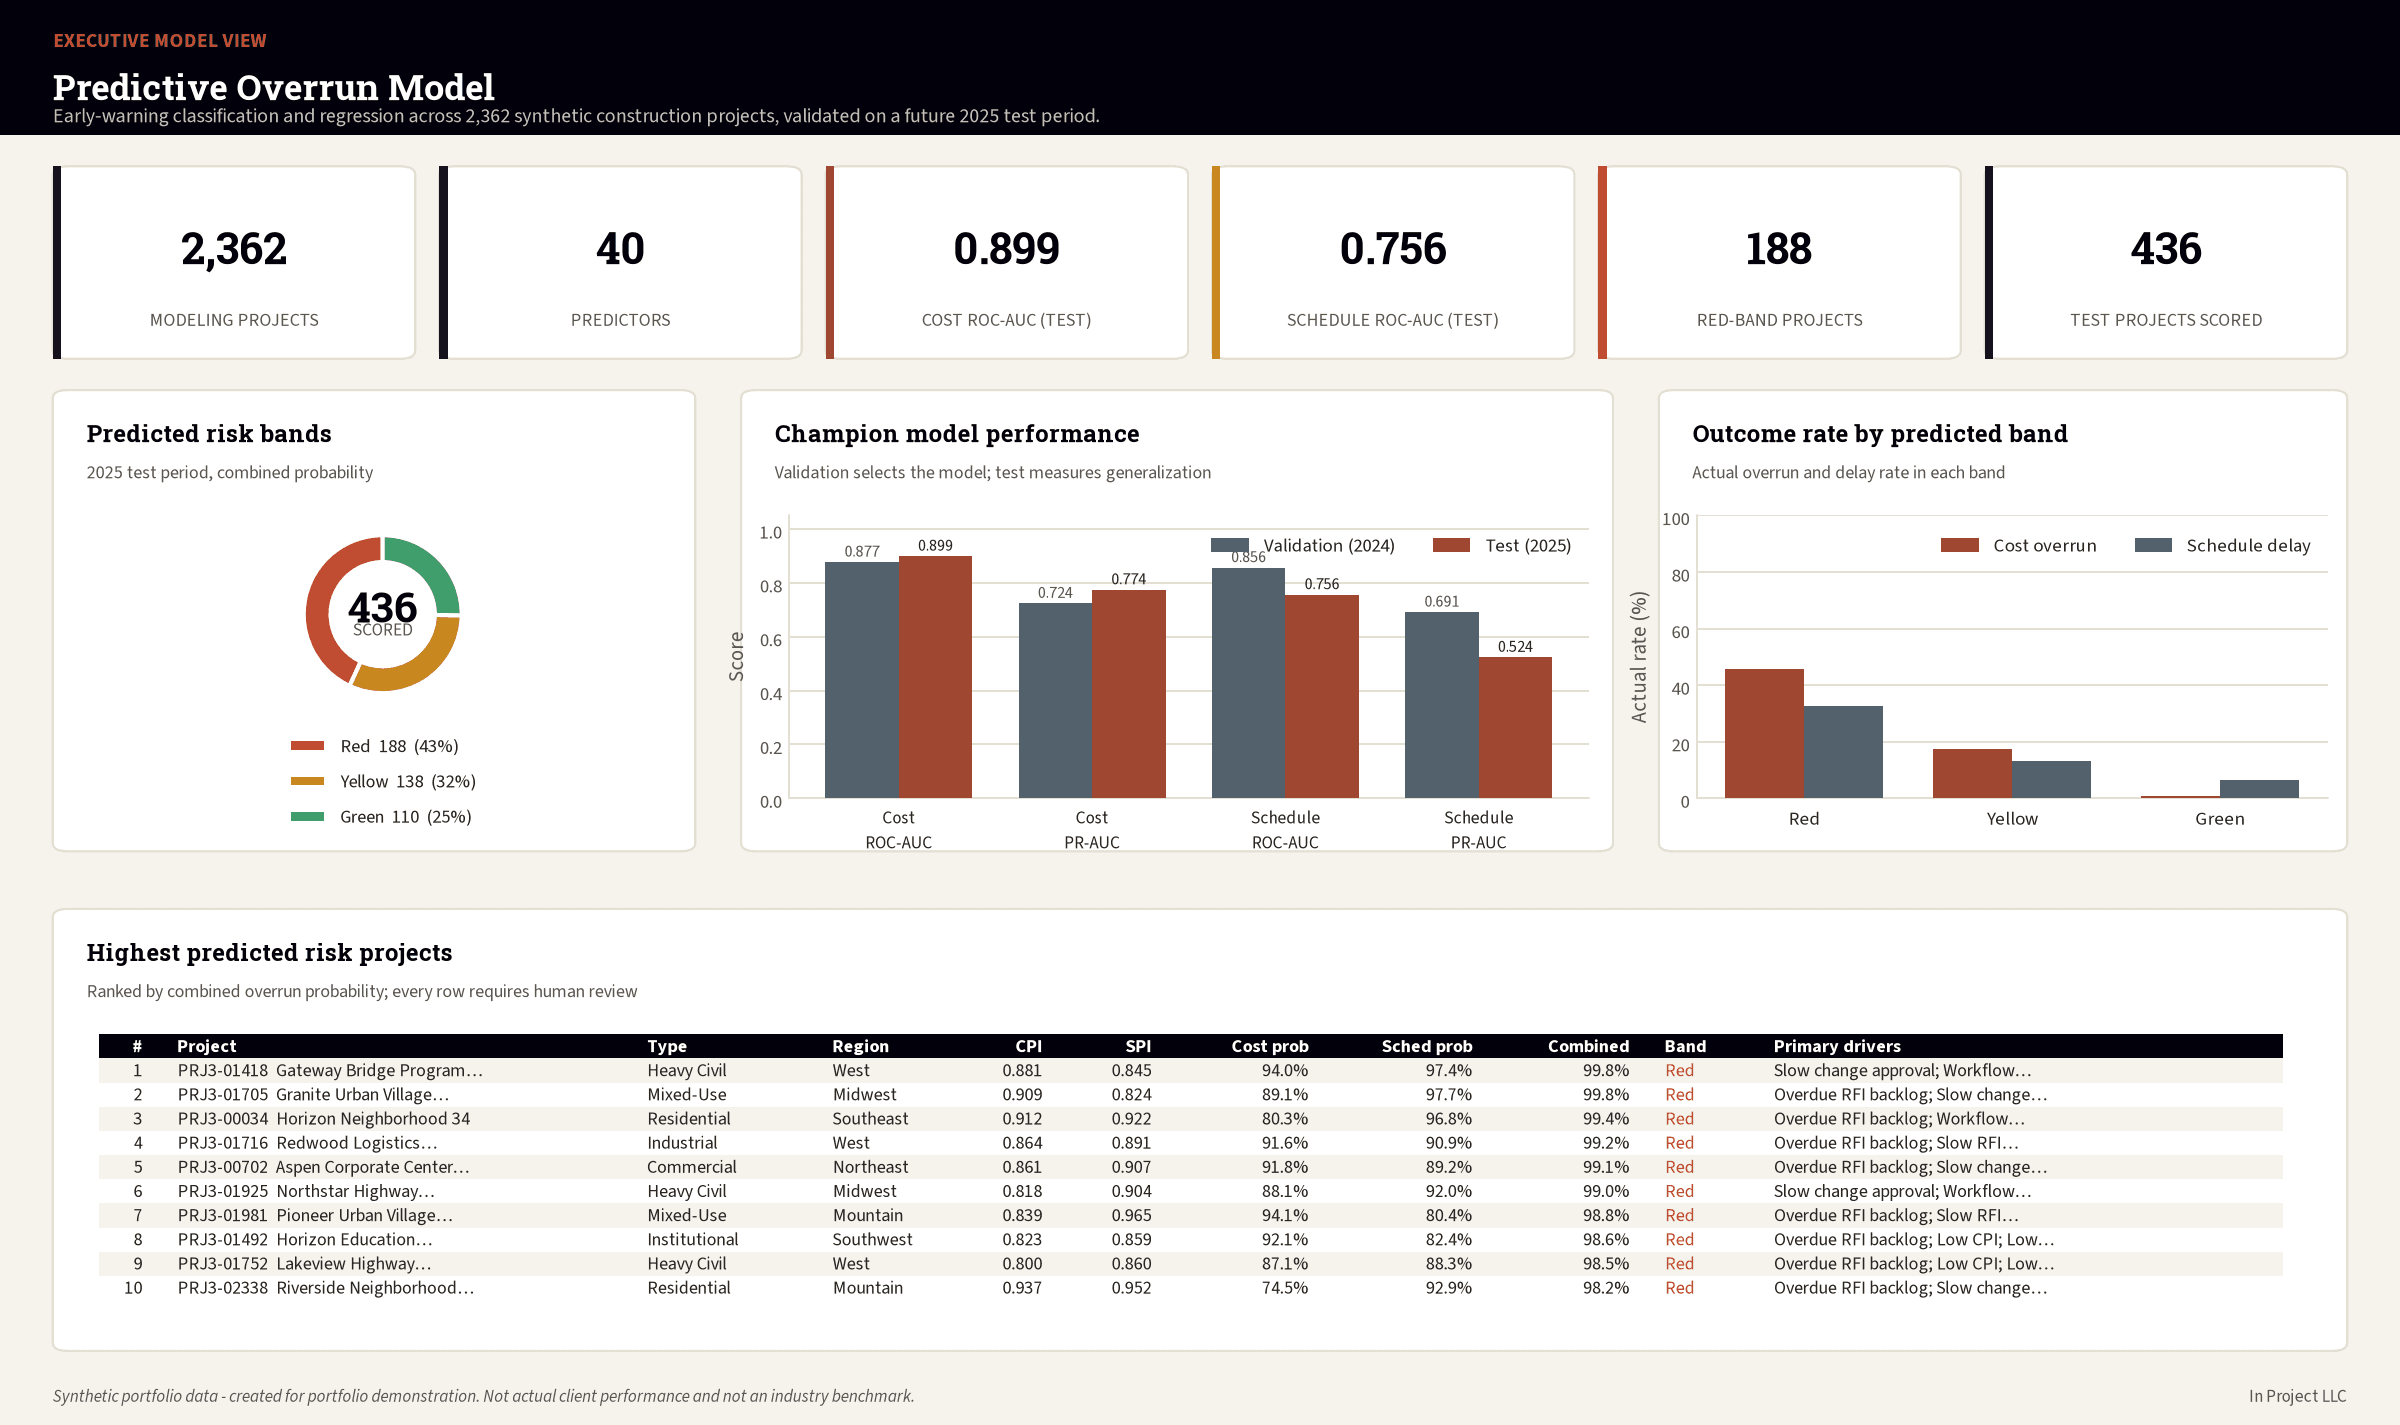
What the analysis concluded
Cost overrun is predictable early; schedule delay is harder
The cost model reaches 0.899 ROC-AUC on a future test year. The schedule model reaches 0.756 and falls further from validation to test — useful for triage, not for commitments.
The schedule model degrades over time, and that is reported
Performance drops between the 2024 validation year and the 2025 test year. That decline drives the retraining triggers and drift thresholds rather than being smoothed out of the results.
The output is a review queue, not a decision
Each project gets a probability and a Red/Yellow/Green band so scarce review time goes where risk is concentrated. A qualified professional confirms or overrides every one; production use is not authorized.
Validated results
Every figure below is reproduced from the analytical outputs in the public repository.
Analytics lifecycle
Executive overview
A complete public case study predicting final cost overrun of at least 10% and final schedule delay of at least 30 days from early and mid-project controls and workflow indicators, using 2,362 clean synthetic project snapshots and 40 predictors.
Business problem and prediction targets
Cost and schedule outcomes are usually confirmed too late to change them. The model predicts two binary outcomes, cost overrun and schedule delay, plus continuous forecasts of final overrun percentage and delay days.
Relationship to Projects 1 and 2
The 40 predictors combine controls concepts from the first case study, including CPI, SPI, variance, and contingency, with workflow concepts from the second, including RFI backlog, change exposure, approval cycles, and revision loops.
Dataset design and snapshot boundary
Each project contributes a single snapshot taken partway through delivery. Final outcome fields sit strictly outside that boundary so the model never sees the answer it is being asked to predict.
Feature lineage
Every predictor is traced to the case study and the operational process that produced it, so a reviewer can challenge any input rather than accept the model as a black box.
Data preparation and leakage prevention
Cleaning, validation, and quarantine run before modeling. Final outcome fields are excluded from predictors, and the test period is untouched during model and threshold selection.
Time-based validation methodology
Models are split by time rather than at random: 1,577 projects from 2019 through 2023 for training, 349 from 2024 for validation, and 436 from 2025 as a future test period. This is the honest test for an early-warning tool.
Classification model comparison
Logistic Regression and Random Forest were compared for both targets. The cost-overrun champion is a Random Forest at test ROC-AUC 0.899 and PR-AUC 0.774; the schedule-delay champion is a Logistic Regression at test ROC-AUC 0.756 and PR-AUC 0.524.
Regression model comparison
Ridge and Random Forest regressors forecast final overrun percentage and final delay days. Cost regression reaches R² 0.520 on the test period; schedule regression is materially weaker at R² 0.333.
Calibration and confusion matrices
Predicted probabilities are compared against observed rates by decile, and confusion matrices at the selected thresholds show the real trade-off between missed overruns and false alarms.
Feature importance
Permutation importance identifies CPI as the leading cost-overrun driver and SPI as the leading schedule-delay driver. Importance measures predictive contribution, not causation: changing a feature will not by itself change the outcome.
Project risk scoring
Each test project receives a cost probability, a schedule probability, a combined probability, and a Red, Yellow, or Green band, producing 188 Red, 138 Yellow, and 110 Green projects for review prioritization.
Temporal degradation finding
Schedule-delay performance declines from validation to the future test period. This was documented as a model-monitoring concern rather than hidden, and it drives the retraining and drift thresholds defined in the Act phase.
Controlled-pilot roadmap
The Act phase defines a staged pilot with defined scope, success criteria, and a decision point, rather than an open-ended rollout.
Human-review workflow
Predictions enter a review queue. A qualified professional confirms, overrides, or rejects each one, and the override is logged as training signal for the next cycle.
Drift, monitoring, override, and retraining controls
Monitoring thresholds, override logging, retraining triggers, incident handling, and a model card are defined before any pilot begins.
Limitations and responsible AI
The data is synthetic and the results are not industry benchmarks. The model establishes association rather than causation, production use on real projects is not authorized by this case study, and predictions support human review rather than replacing qualified project judgment.
Model performance and calibration
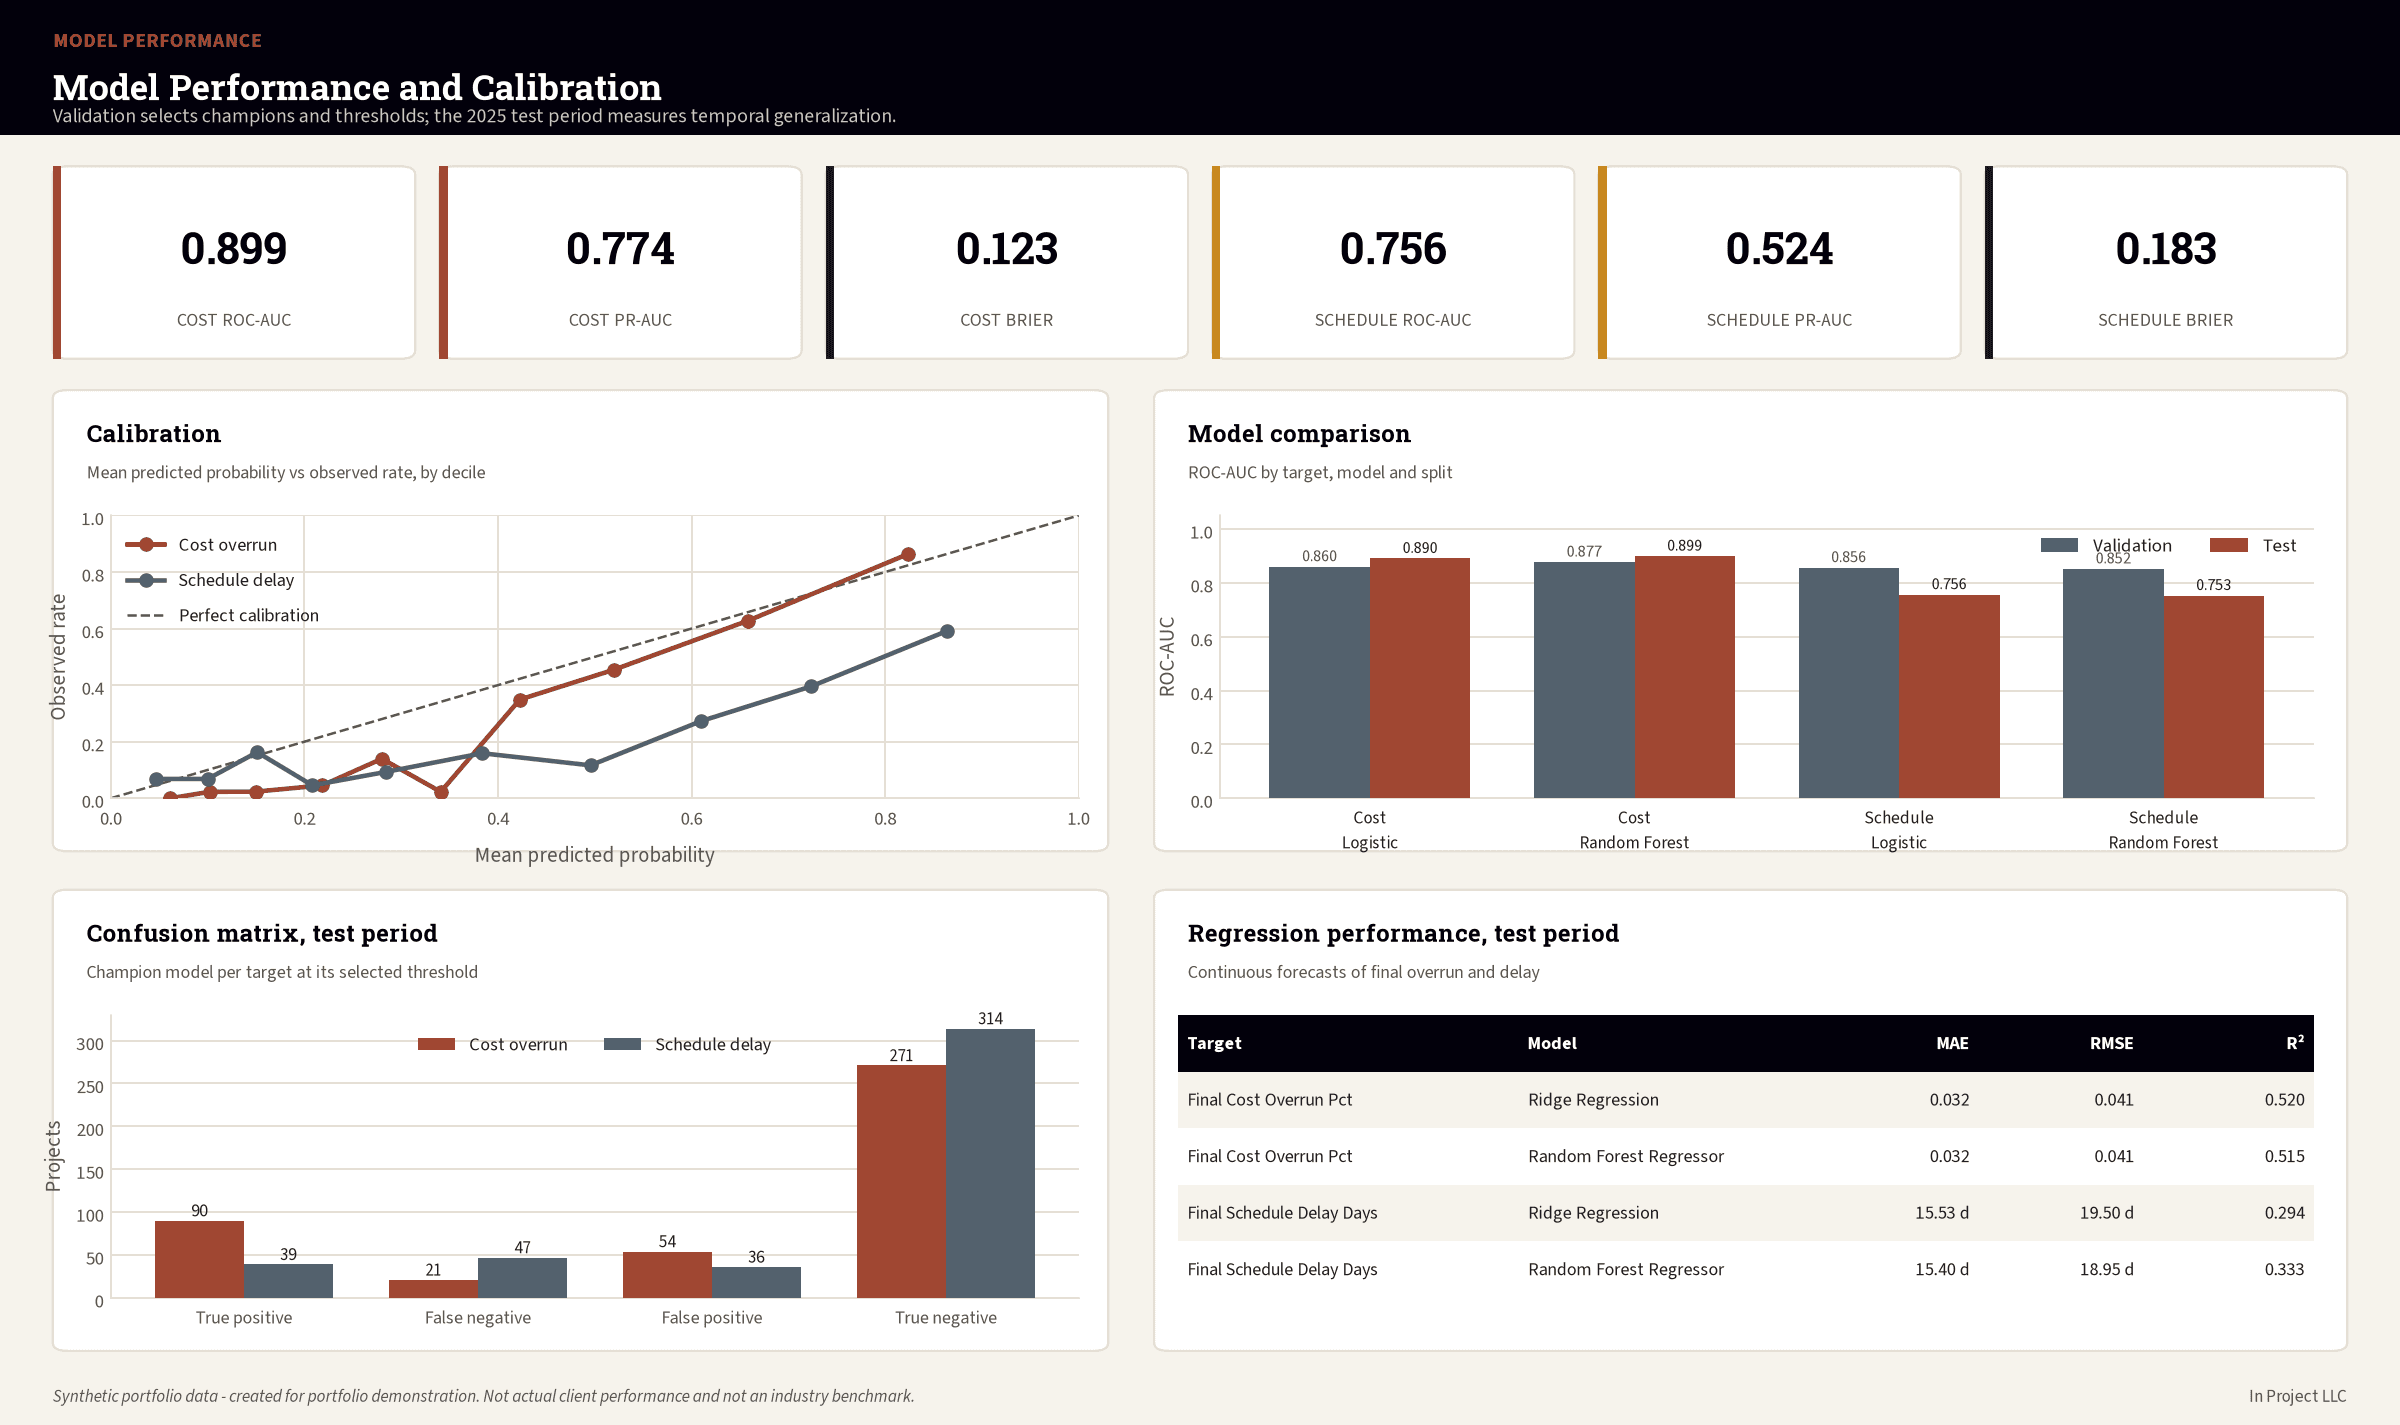
Model performance and calibration: predicted probability against observed rate, model comparison across both targets and splits, and the confusion matrix.
Authorized use
Production use on real construction projects is not authorized by this case study. The model is human decision support: predictions prioritize review, and a qualified professional remains accountable for every decision.
Synthetic-data disclosure
All projects, organizations, budgets, schedules, workflow records, and outcomes in this case study are synthetic. Model results are portfolio demonstrations, not industry benchmarks.