Change orders and RFIs move through many reviews, handoffs, and approvals. This case study identifies where cycle time, aging, backlog, and handoff patterns create cost and schedule exposure.
Dashboard
90 synthetic projects · 3,318 RFIs · 1,119 change orders · 2022–2025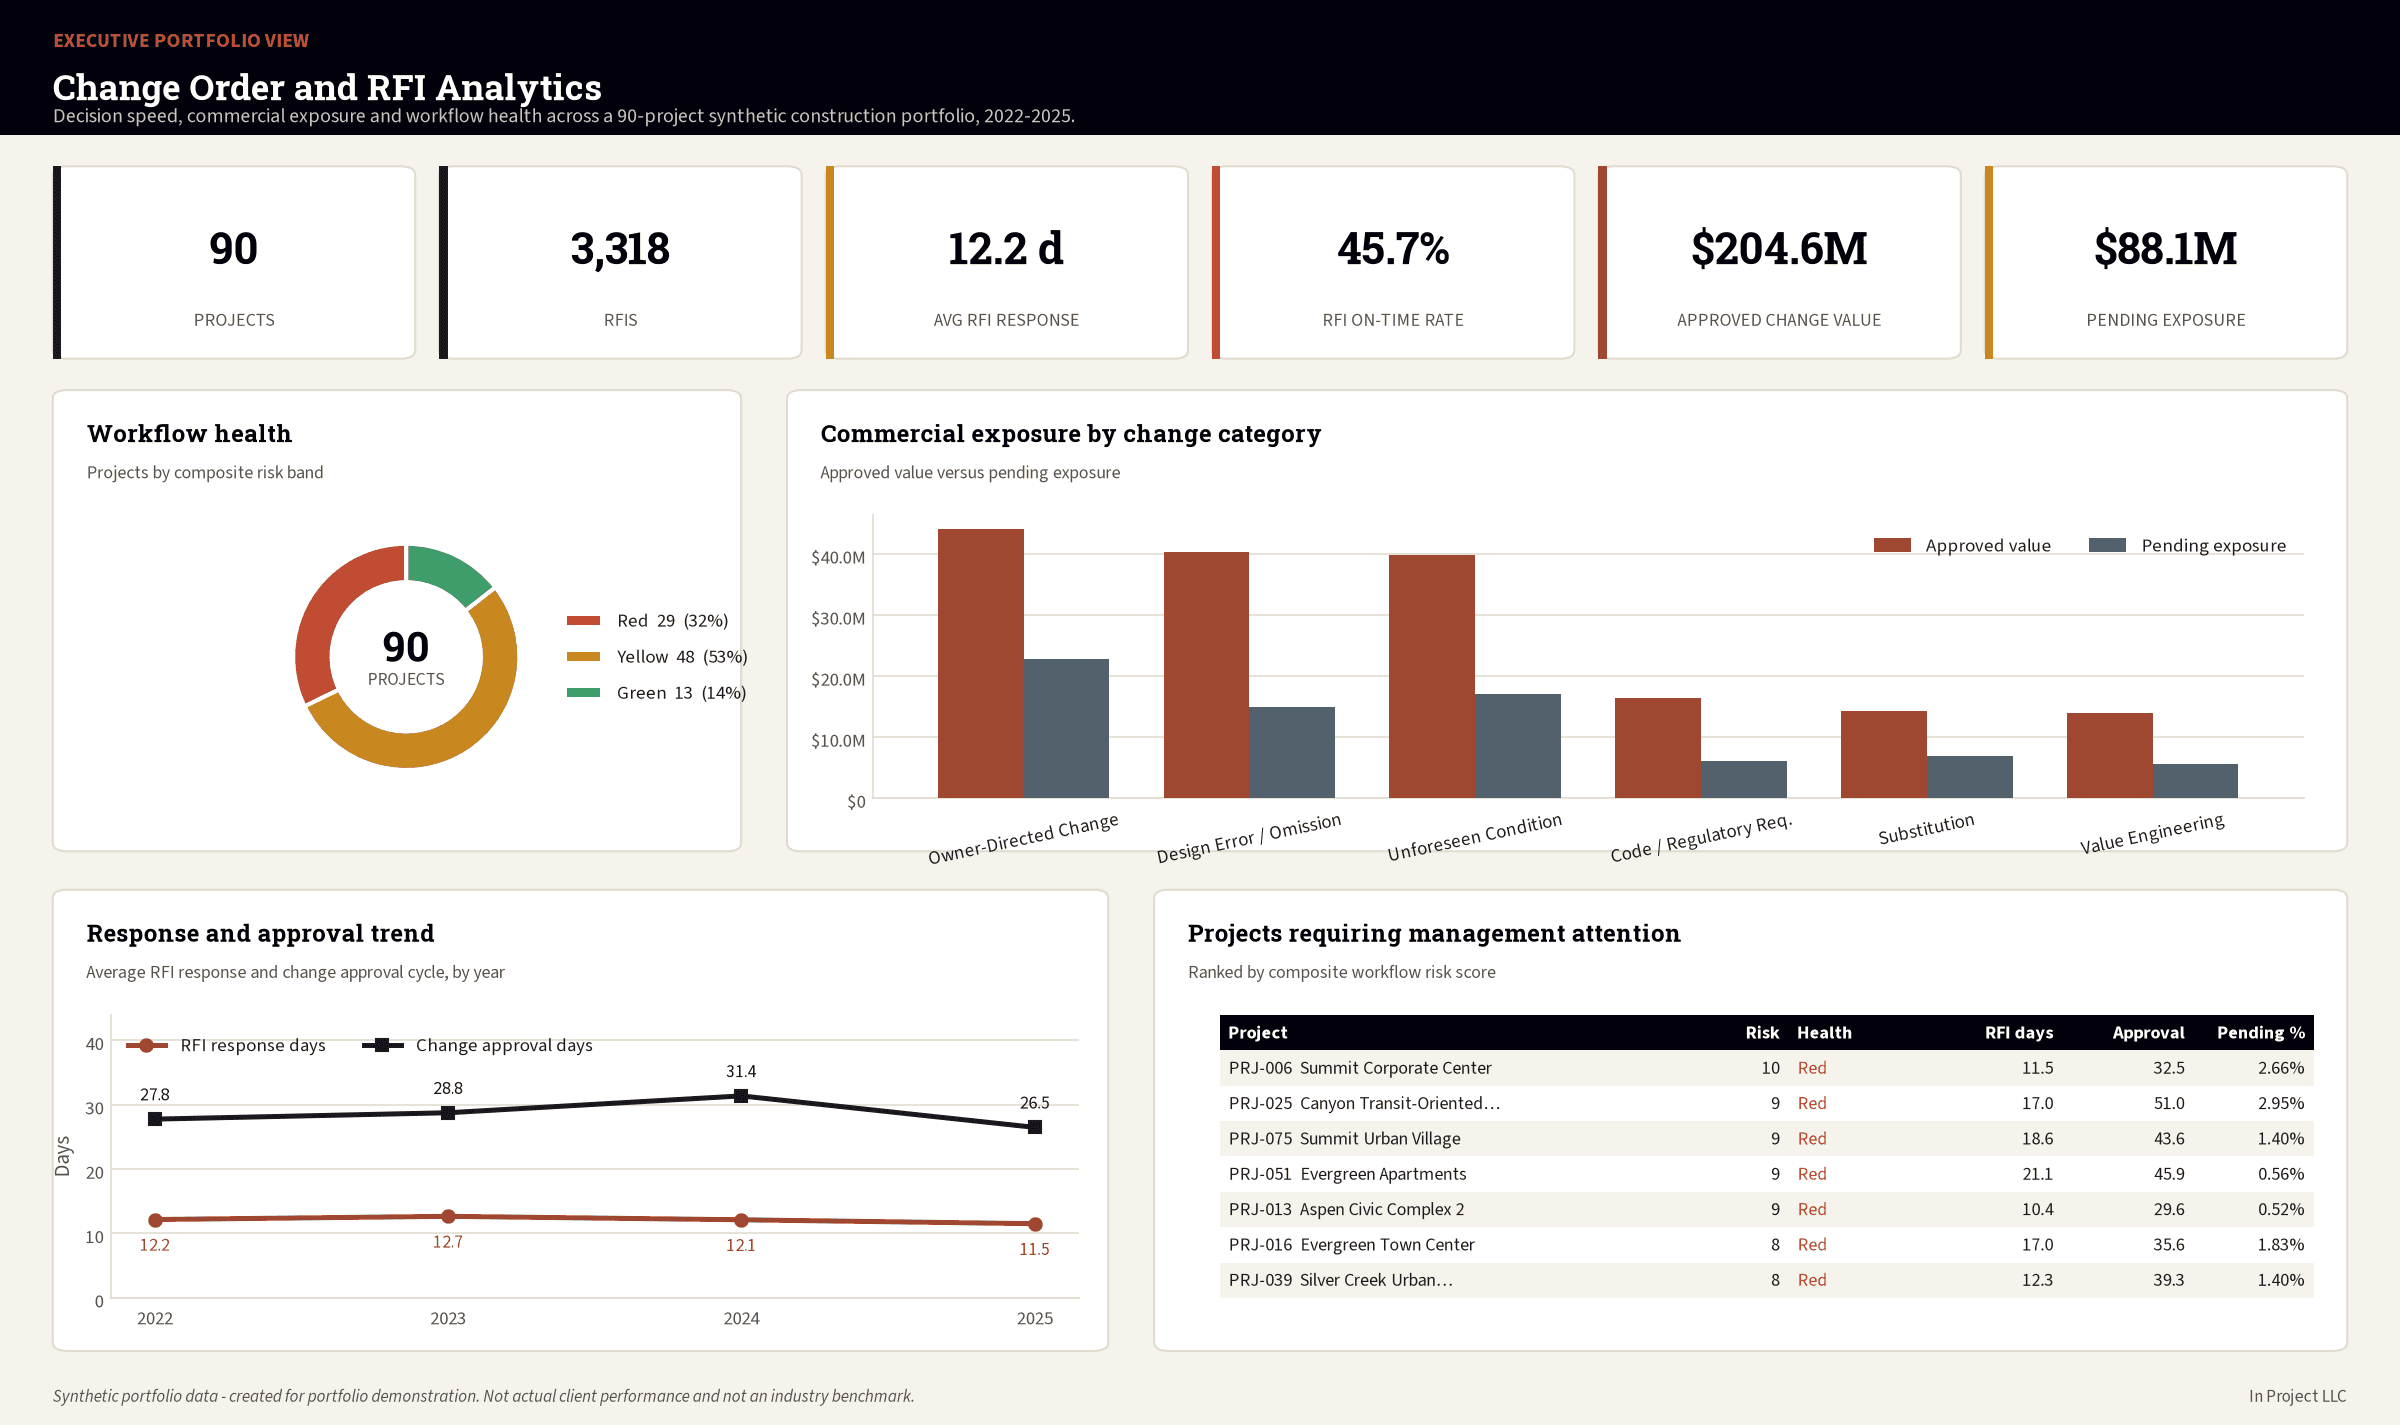
What the analysis concluded
RFI response and change approval are one system, not two
Projects slow at answering RFIs are the same projects slow at approving changes (r = 0.817, the strongest tested relationship). Fixing them separately treats one problem twice.
Rework, not review, is where the time goes
Change orders returned for revision account for the largest single block of accumulated stage time. The delay is not careful review — it is the same document going round again.
Owner decision speed sets the pace of everything downstream
Slow-decision projects average 16.45 response days and 26.3% on-time, against 10.4 days and 52.8% where decisions are fast. The owner's cadence, not the contractor's, is the binding constraint.
Validated results
Every figure below is reproduced from the analytical outputs in the public repository.
Analytics lifecycle
Executive overview
A complete public case study analyzing RFI response performance, change-order approval cycles, workflow-event histories, commercial exposure, and project-level management priorities across 90 synthetic construction projects.
Business problem
Change orders and RFIs pass through many reviews, handoffs, and approvals. Each pause is invisible in a monthly cost report, yet the accumulated delay shows up as commercial exposure and schedule pressure.
Primary question
Which change-order causes and RFI workflow conditions create the greatest cost and schedule exposure, and where should management intervene to improve response and approval performance?
Stakeholders
Project managers, project-controls teams, design managers, commercial and contracts staff, owners, and executives responsible for portfolio decisions.
Analytics lifecycle
Ask, Prepare, Process, Analyze, Share, and Act, aligned to CRISP-DM, DMAIC, Microsoft's data-science lifecycle, and PMI process groups.
Relational data model
The processed dataset contains 90 clean projects, 3,318 clean RFI records, 1,119 clean change orders, 11,286 clean workflow events, and 677 clean RFI-to-change links.
Data quality and cleaning
Duplicates removed, categories standardized, invalid relationships quarantined rather than guessed, one-to-one relationships enforced, and every treatment logged before analysis.
RFI performance
Average RFI response is 12.21 days against a 45.7% on-time rate, with 295 overdue open RFIs. Response speed varies by discipline, and every discipline sits below a healthy on-time threshold.
Change-order exposure
Approved change value reaches $204.57M with $88.10M still pending. Owner-directed changes, design errors or omissions, and unforeseen conditions account for the largest share of approved value.
Workflow bottlenecks
Stage-duration analysis locates where time accumulates by item type and accountable role, and separates genuine review time from rework loops returned for revision or clarification.
Statistical relationships
Project-average RFI response and project-average change approval cycle produce the strongest tested portfolio relationship at Pearson r = 0.817. This is an association between two workflow speeds, not evidence that one causes the other.
Project workflow-risk framework
Each project receives a composite workflow-risk score from response time, overdue backlog, approval cycle, pending exposure, forecast lag, and incorporation performance, producing 29 Red, 48 Yellow, and 13 Green projects.
Management recommendations
Treat RFI response and change approval as one connected decision system, target the slowest accountable stages, reduce rework loops, and incorporate approved changes into forecasts on a fixed cadence.
Automation and governance
A Python alert generator and PowerShell pipeline produce management alerts from validated analysis outputs, with governance cadence and KPI targets defined in the Act workbook.
Limitations
The data is synthetic. Correlation does not establish causation, exploratory models are not approved for production use, and group comparisons are portfolio observations rather than industry benchmarks.
Workflow bottlenecks and drivers
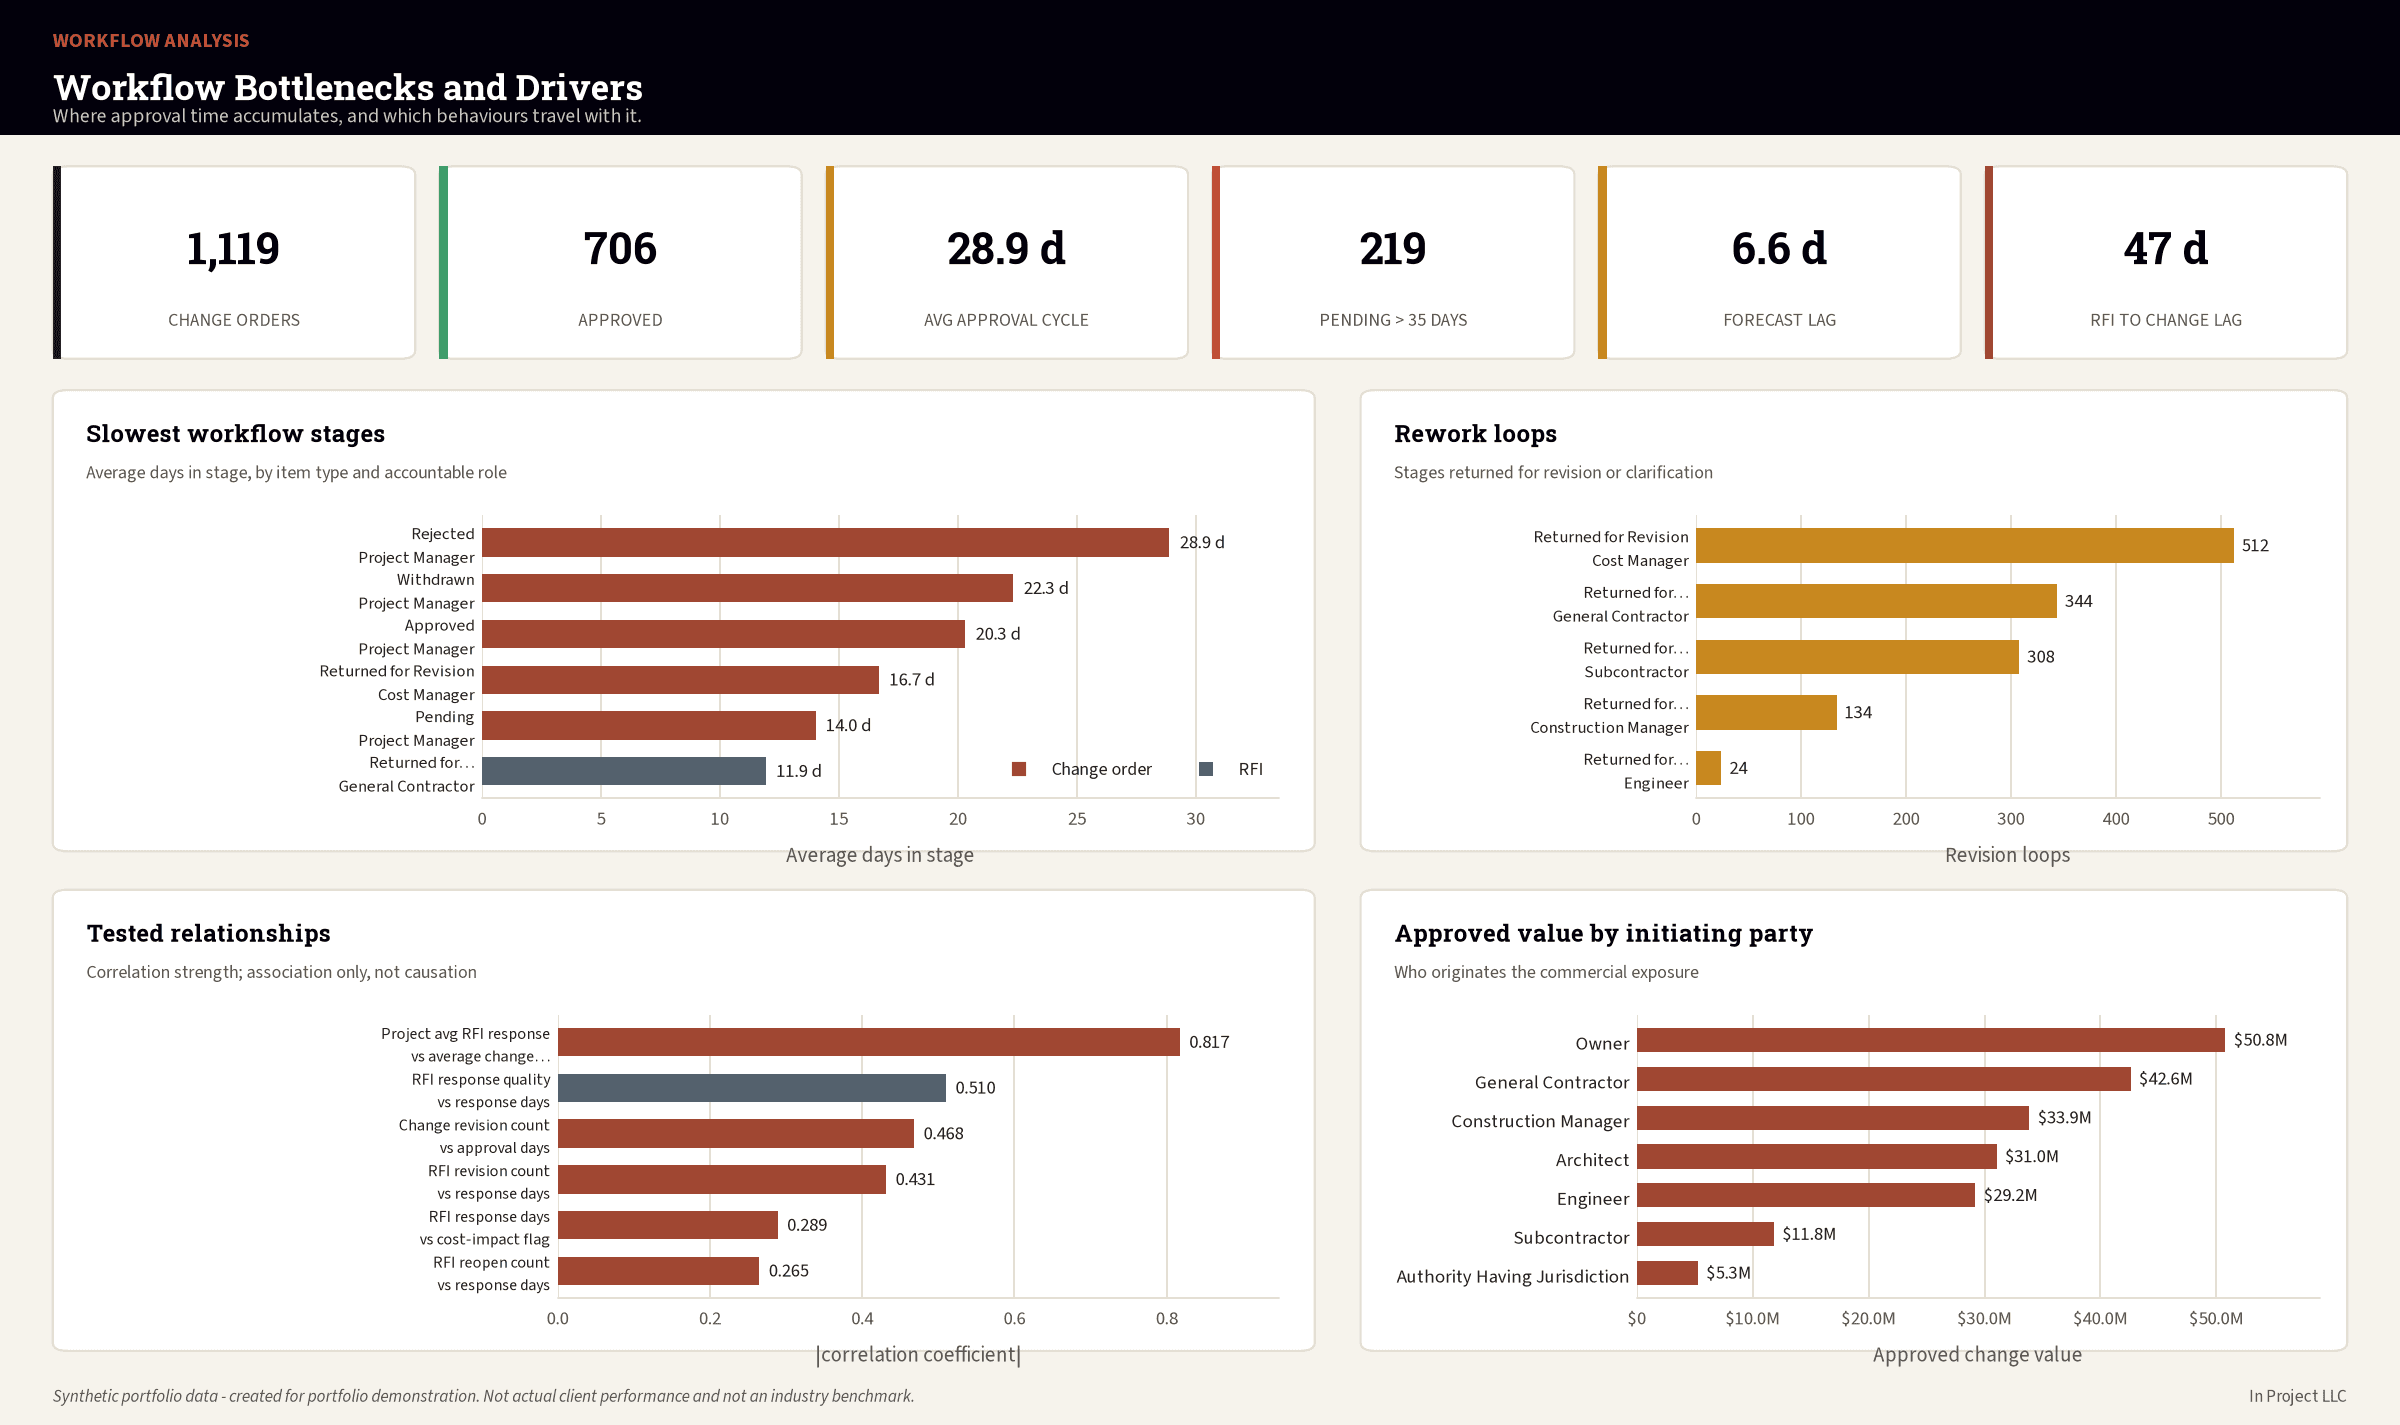
Workflow bottlenecks and drivers: the slowest stages, rework loops, tested relationships, and approved value by initiating party.
Synthetic-data disclosure
All projects, organizations, people, budgets, schedules, RFIs, change orders, workflow events, and performance records in this case study are synthetic and must not be represented as actual client, company, or industry-benchmark information.