Project teams often detect cost and schedule stress after intervention options have narrowed. This case study tests which controls metrics move early enough to support management action.
Dashboard
75 synthetic projects · $5.83B portfolio · 2022–2025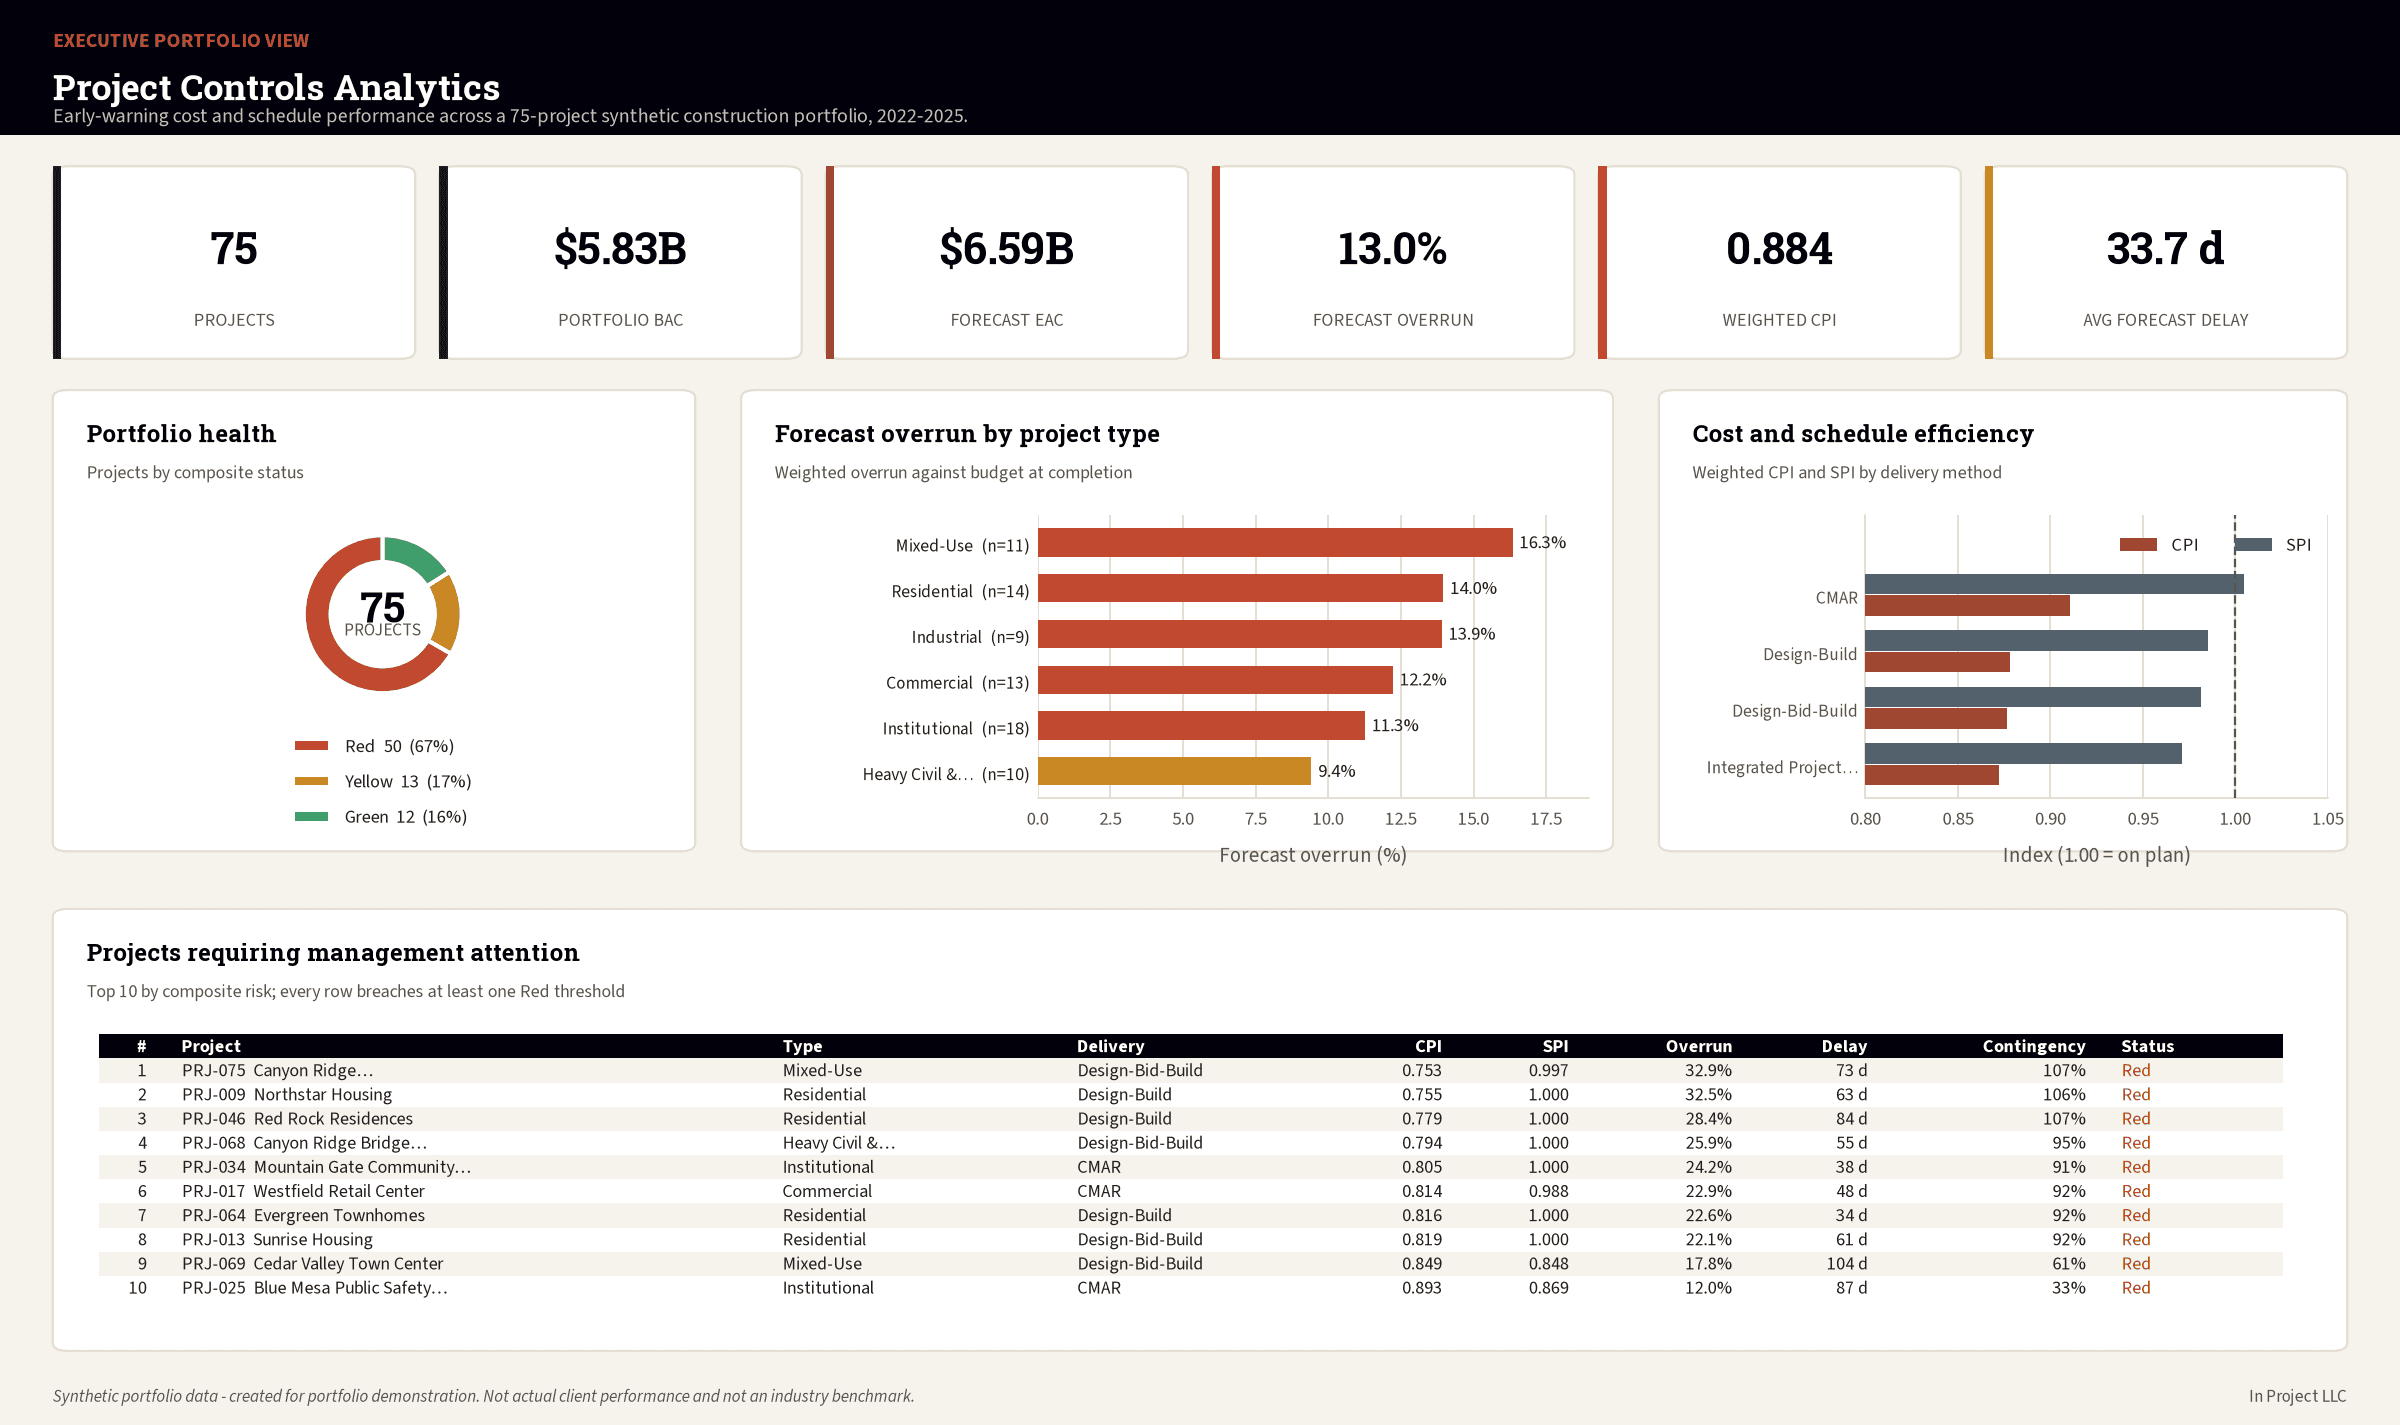
What the analysis concluded
Contingency burn is the earliest reliable warning
It explains 81% of the variance in final overrun and is measurable from month one — well before CPI crosses a reporting threshold. If one number gets watched weekly, this is the one.
A healthy schedule index can hide a late project
Weighted SPI sits at 0.987 while the average project still finishes 33.7 days late. SPI converges to 1.0 as work completes regardless of the finish date, so delay has to be tracked in days.
How fast RFIs are answered matters; how many there are does not
Response time tracks with schedule delay (r = 0.517) while RFI density does not (r = -0.058). The constraint is turnaround, not volume — which points at process, not workload.
Validated results
Every figure below is reproduced from the analytical outputs in the public repository.
Analytics lifecycle
Executive overview
A completed end-to-end portfolio analytics case study evaluating early-warning indicators across 75 synthetic construction projects with a $5.831B budget at completion and a $6.587B forecast at completion.
Business problem
Cost and schedule stress often becomes visible after the practical window for intervention has narrowed. The study focuses on earlier signals that management can monitor from month one.
Primary question
Which project-controls metrics move first, early enough to intervene before overruns become unavoidable?
Stakeholders
Executive sponsors, project managers, project-controls teams, owners, finance reviewers, and operations leaders who need clear risk visibility.
Analytics lifecycle
Ask, Prepare, Process, Analyze, Share, and Act, supported by terminology and practice from CRISP-DM, DMAIC, Microsoft's data-science lifecycle, and PMI project-governance process groups.
Relational data model
Projects, monthly performance, change orders, and RFI logs, with analysis views for project performance, RFI summary, change-order summary, and latest monthly performance.
Data quality and cleaning
The workflow validates data types, deduplicates records, applies quality checks, loads a SQLite database, and documents known limitations rather than hiding them.
Analytical results
The portfolio is forecast to finish 13.0% over budget at a weighted CPI of 0.884, with an average forecast delay of 33.7 days and 50 of 75 projects at Red status.
Early-warning relationships
Contingency burn ratio has the strongest tested association with forecast overrun (Pearson r = 0.901). RFI response time shows a weaker but real association with schedule delay (r = 0.517), while RFI density does not. These are associations, not causal claims.
Management recommendations
Track contingency burn from month one, review CPI thresholds before monthly reporting closes, separate cost and schedule change-order drivers, and manage RFIs as a systemic workflow constraint.
Automation and governance
The repository includes a PowerShell pipeline runner and a Python management-alert generator that produces alert outputs from the validated analysis data.
Limitations
The data is synthetic, correlations are not causal claims, small subgroups are not generalized, and retained data-quality gaps are disclosed in the project documentation.
Operational insights
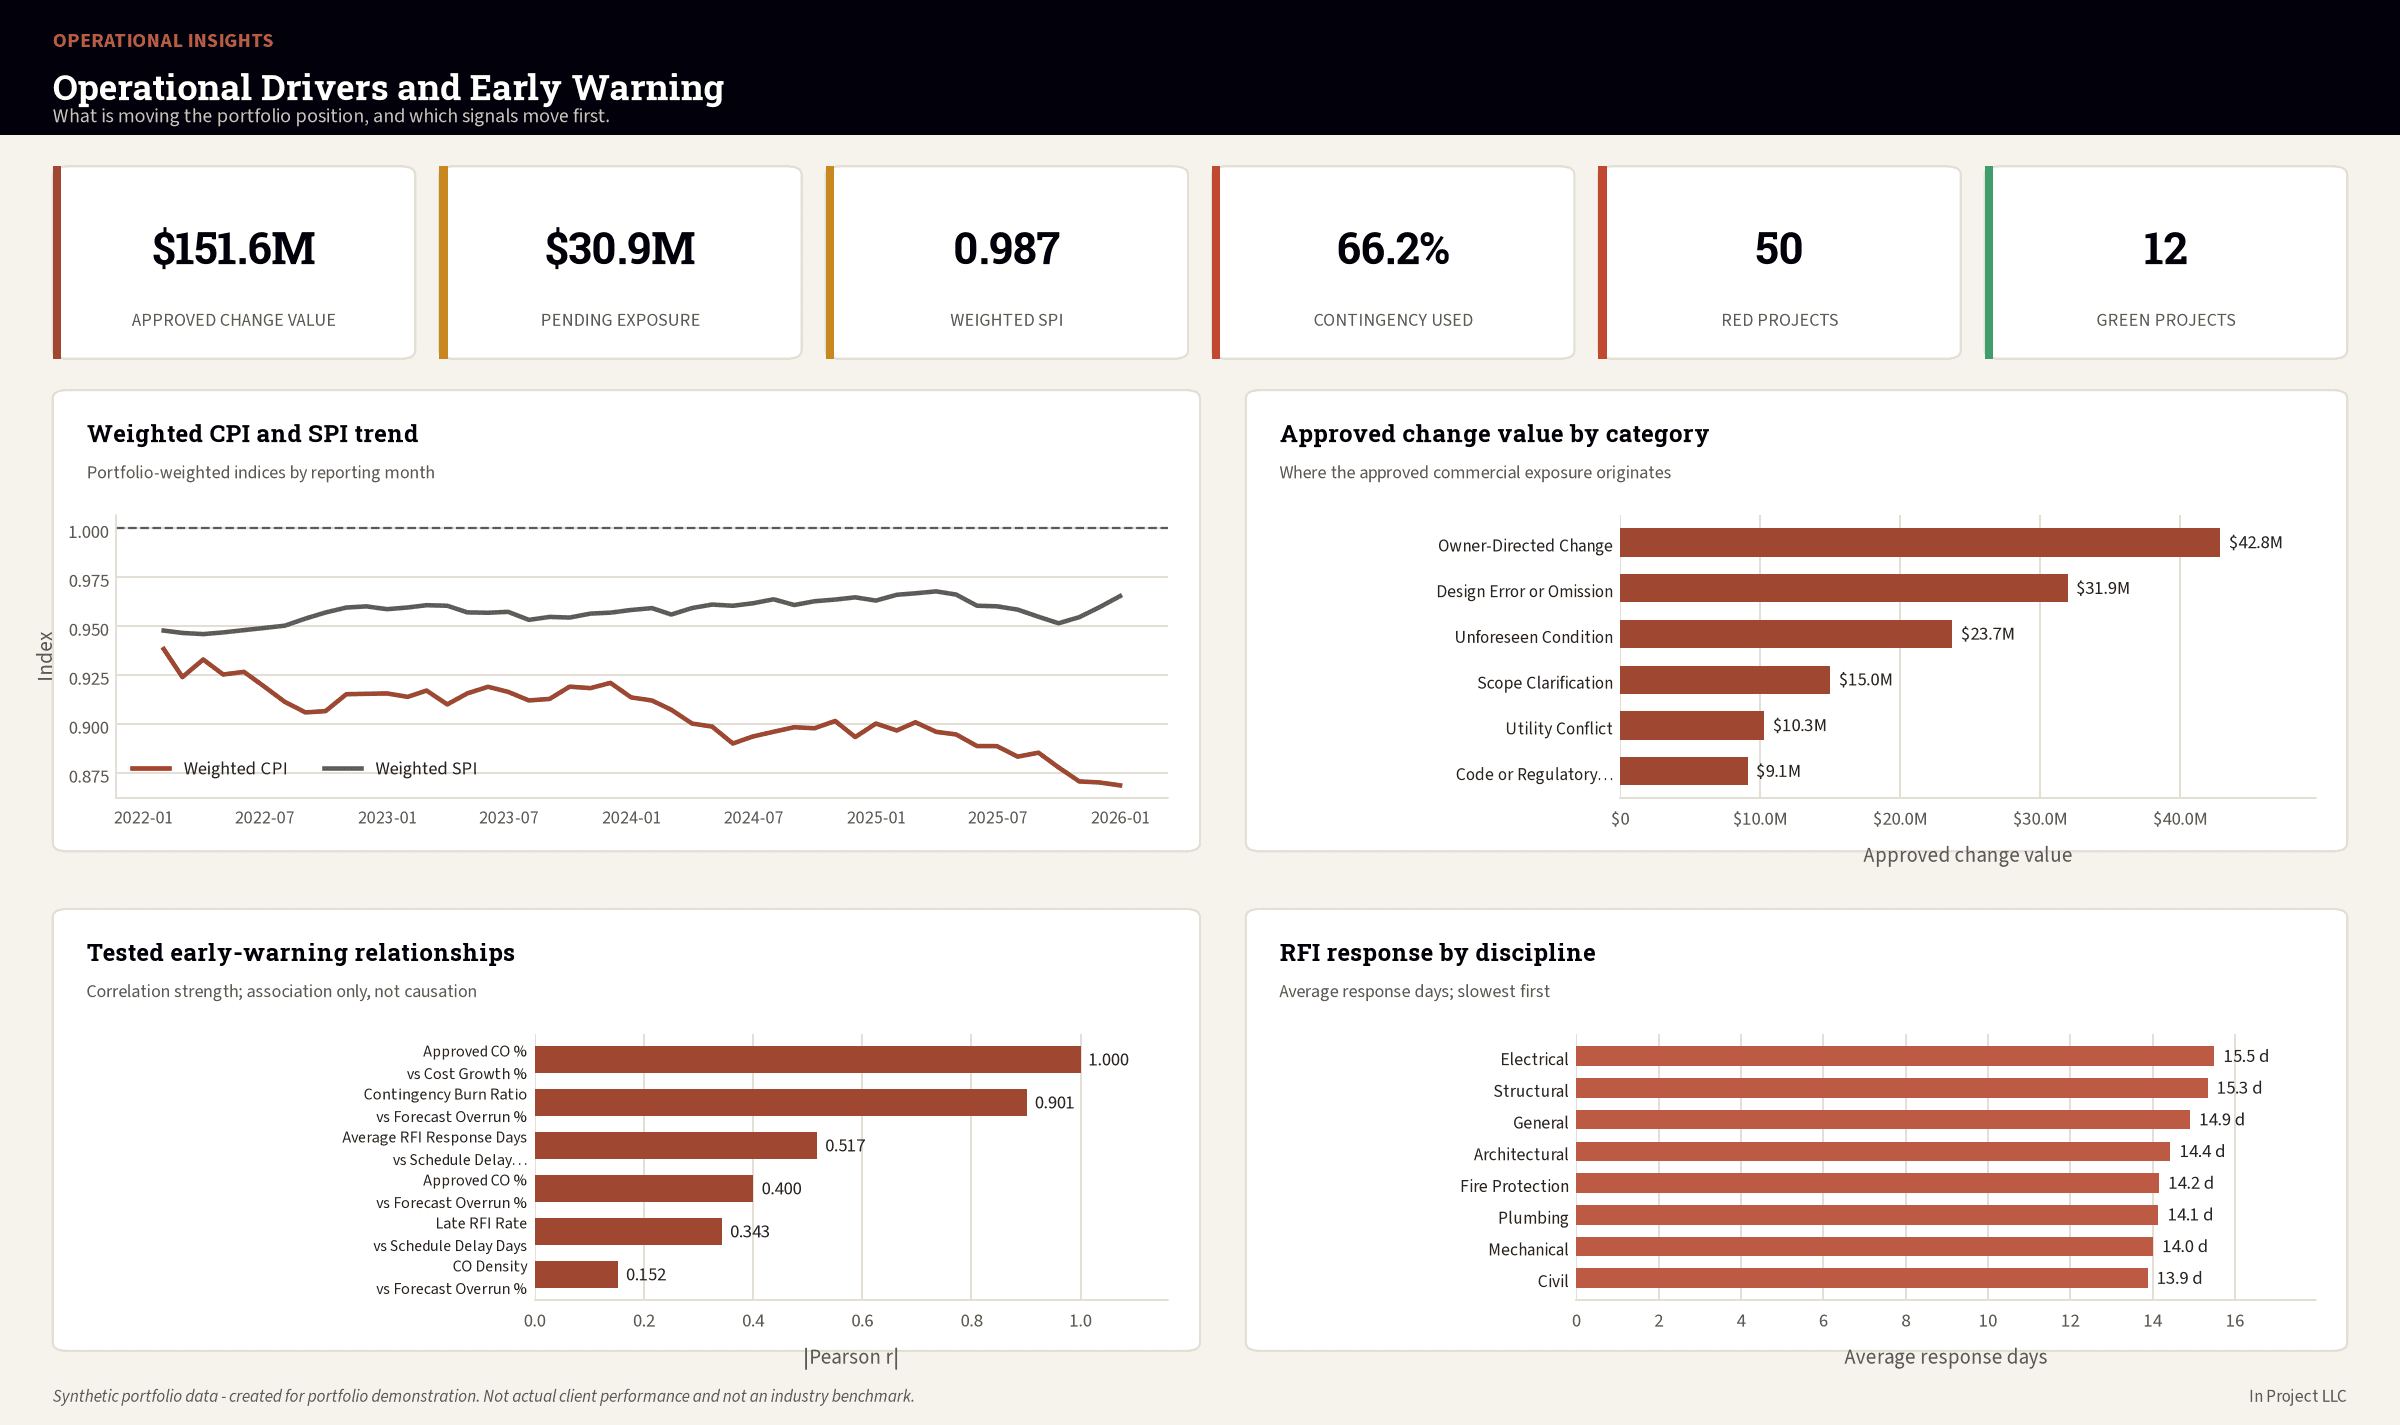
Operational insights: CPI and SPI trend, approved change value by category, tested early-warning relationships, and RFI response by discipline.
Synthetic-data disclosure
All project, client, cost, schedule, RFI, and change-order data in this case study is synthetic and does not represent actual client performance or confidential records.